
Once you have confirmed that data has been successfully loaded to Pereview, you can begin the process of validating the data, ensuring it aligns with your internal expectations and partner-provided reports.
Validation in Pereview can be broken down into the three tiers below. Each tier goes progressively deeper: Tier 1 confirms the data is present and displayed, Tier 2 confirms account-level ending balances, and Tier 3 confirms that the subtotals your team reports on reconcile to the partner's Income Statement.
|
Tier |
The Question It Answers |
What It Verifies |
When to Run |
|
Is the data loaded? |
Data for the expected periods is present in Pereview and the Balance Sheet balances. |
Monthly |
|
|
Do the balances tie? |
Ending balances by GL account in Pereview match the ending balances on the latest partner Trial Balance. |
Monthly |
|
|
Is the data mapped correctly? |
Accounts are grouped and mapped so that statements, subtotals such as NOI, and dashboards reflect the data accurately. |
Periodically |
Working Across a Portfolio
While the steps in this guide are geared for a single property, because that is how discrepancies are typically investigated, teams often times are reviewing their entire portfolio as part of this process.
As a result, reports in Pereview can be run for any number and combination of properties, so we recommend breaking up the monthly validation cycle into two phases:
- High Level Screen Across the Portfolio: Run the Tier 1 and Tier 2 reports for all assets, or for a fund or portfolio at a time, and look only for items that do not tie out. The Financial Upload Status report and the GL Balances for Latest Post Date report may be run for any grouping of assets. Often times, this high-level pass can constitute the entire validation exercise assuming no discrepancies or exceptions are found.
- Drill-Down on Exceptions: Work property by property only on the assets that failed the initial high-level screen. Isolating a single property is what makes a discrepancy traceable, so narrow it to one asset before troubleshooting rather than trying to diagnose several at once.
Segmenting the work in this manner keeps the monthly effort proportional to the number of problems rather than the number of properties.
Tier 1 Validation: Is the Data Loaded?
Part A: High-Level Review
Tier 1 validation primarily answers the question; did the data arrive, and does it tie out? Start with a top-down look at the Balance Sheet, dashboards, and major KPIs.
- Confirm the Balance Sheet Balances: Go to Formatted Reports and run the Balance Sheet. Confirm that Assets = Liabilities + Equity. This is a quick way to determine whether there is a discrepancy that needs attention.
- Verify the As-of Date: Ensure the data reflects the correct period, such as year-to-date actuals through the latest expected month. This can be confirmed in the Financial Upload Status report, or in the “PostDateKey” column of the GL Balances for Latest Post Date report.
- Review Dashboard Widgets: Examine the reported NOI, Revenue, and Expenses for each period on the Asset or Collateral Overview pages. At this stage you are looking for figures that are missing or obviously incorrect.
Important Note: Identifying a Tier 1 validation discrepancy does not necessarily tell you what the root cause is, or what the necessary correction will be. For example, a Balance Sheet that does not balance usually points to missing or incomplete data, which is resolved in Tier 2 validation. A figure that is present but lands in the incorrect account usually points to a mapping issue, which is resolved in Tier 3 validation. Work through the tiers in order rather than jumping straight to the mapping.
Recommended Best Practices: Tier 1 Validation
☐ Every expected period appears in Pereview for the property.
☐ The Balance Sheet balances: Assets = Liabilities + Equity.
☐ The as-of date reflects the latest period you expect loaded.
☐ Dashboard widgets show NOI, Revenue, and Expenses, with no figure unexpectedly blank.
Tier 2 Validation: Do the Balances Tie?
Part A: Ending Balance Validation
Tier 2 validation confirms that Pereview and the source partner/PMC data agree with each other. This is achieved by ensuring the ending balances for each GL account in Pereview align exactly with the ending balances for each GL account on the latest partner-provided Trial Balance. Keep in mind that only ending balances are valid comparisons when reviewing Pereview against partner statements. Debits, credits, and beginning balances can vary because your partner’s system updates continuously while Pereview holds the monthly statements as they were loaded at the time.
- Pereview Side of the Comparison: Run the GL Balances for Latest Post Date report, which returns account-level ending balances in the “AccountBalance” column. The Source System Ending Balance column pulls from the latest uploaded Trial Balance. The Difference column calculates any differences between the two figures. Note that it reports as of the latest post date only and does not look back at earlier periods.
- Uncovering the Differences: Now set Only Differences to Yes to return only the accounts where Pereview and the partner figures disagree. This is the fastest way to review a group of properties at once. A blank report is a good result: it means every account ties for the properties selected. Set it to No when you are investigating a specific property, so you can see every account including those with zero balances. Note that on properties where the Source System Ending Balance does not populate, every account will appear as a difference, so Only Differences will return the full report rather than a short exception list.
- Review Differences: Pereview highlights any non-zero figure in the Difference column automatically. On a property loaded from a Trial Balance file, highlighted rows are the variances to investigate. On a property loaded from a General Ledger file, the entire Difference column will be highlighted because the Source System Ending Balance is not populated. This is the expected behavior for such a property and means that a manual comparison is required to complete tier 2 validation. For some file types, the Source System Ending Balance and Difference columns may not automatically calculate (see table below).
- Compare Against Trial Balance: Depending on which ERP system the source data originated from the system may automatically calculate the differences, or you may be required to manually calculate. Additionally, a manual comparison using the PMC Chart of Accounts mapping report may be required. The table below can be used as a quick reference guide to determine if manual calculation and review will be required.
|
Source File Type |
Source System Ending Balance Populates? |
Difference Auto-Calculates? |
|
Pereview AI for G/L |
Yes |
Yes |
|
Trial Balance (Yardi Voyager, OneSite, MRI) |
Yes |
Yes |
|
General Ledger or Transaction GL file |
May not populate |
No. Compare manually |
|
General Ledger API automation (Entrata, MRI) |
May not populate |
No. Compare manually |
Note: When a manual comparison is needed, export the report to Excel and use your PMC Chart of Accounts mapping to line up source accounts against Pereview accounts. One Pereview account can aggregate several partner accounts, so compare at the Pereview account level. The target is zero difference on every account.
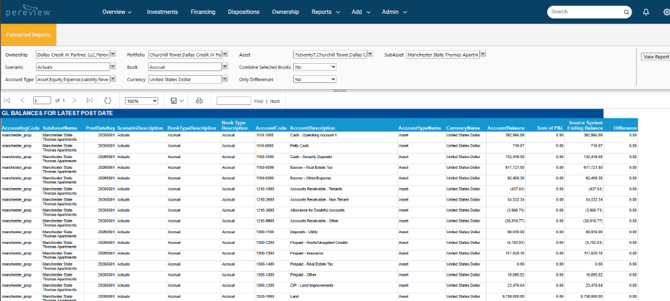 A GL Balances for Latest Post Date report. For this property, the source data was loaded via Yardi Voyager Trial Balances. Note how the Source System Ending Balance column (PMC values) is populated and equals the Account Balance column (Pereview values) for each row, meaning the Difference column (difference between PMC and Pereview values) is 0.00 for each GL account.
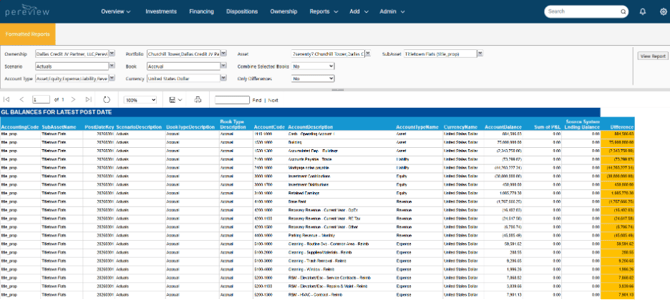 Another example of a GL Balances for Latest Post Date report. For this property, the source data was loaded via Transaction GL from PMC file. Note how the Source System Ending Balance column is not populated. This does not mean each account necessarily differs from the source data, but that a manual comparison is needed instead of relying on the Difference column.
Note on General Ledger Files: Tier 2 compares ending balances by account, which a Trial Balance provides directly. Many general ledger exports do not present ending balances by GL account in a form Pereview can ingest. Where a Trial Balance is available for a property, use it as the Tier 2 comparison. When only a general ledger is available, you can confirm the ending balances from it before confirming Tier 2 as complete for the property in question.
Part B: Understanding Discrepancies
If Tier 2 uncovers a discrepancy, the composition of the difference usually tells you the likely cause. Below are some common discrepancy types and their likely cause:
- Many Accounts Show a Difference: Confirm accurate source data. Common causes are duplicated data, a missing month, the incorrect statement, or the incorrect accounting book (ex. Cash loaded where Accrual was expected). For a newly set up PMC, the issue may be in the PMC Chart of Accounts Mapping. Ensure accounts are not crossing in the mapping from the PMC Balance Sheet to Pereview Income Statement, and vice versa.
- Accounts Show Differences, and They Net to Zero: This is typically the result of a reclass or a prior period adjustment; meaning a journal entry was subsequently booked by your partner in a period that had already been loaded to Pereview. Request updated statements for the affected periods and re-load them. This resolves the differences in nearly all cases.
- One Account is Short by a Clean Amount, and Nothing Offsets It: Determine whether the account code exists in your PMC Chart of Accounts and is mapped appropriately in Pereview.
- Accounts Tie Individually but a Statement Total Does Not: The accounts are loaded correctly however the account grouping is most likely incorrect. This type of issue is an example that would be resolved Tier 3validation.
- Retained Earnings: Not every difference is a defect. The most common expected difference is in Retained Earnings, and it is a difference in presentation rather than in data.
Important: Where the cause is duplicated data, an incorrect statement, or an incorrect accounting book, the incorrect data must be deleted before the corrected file is loaded. See Deleting Data Loads for more information.
Most partners make prior period adjustments at some point during the year, particularly around tax season or calendar year end, which can cause discrepancies in Pereview. A practical method to help mitigate this risk is to ask each partner to include a rolling prior six months of Trial Balances with every monthly submission, as a standard part of your monthly data request. Most prior period adjustments fall within that window, so the restated data updates within Pereview before it can ever cause a problem.
Expected Differences:
Pereview reports Retained Earnings at its last closed balance and carries the current year’s earnings separately, in the Sum of P&L column of the GL Balances for Latest Post Date report. That column is the sum of all Income Statemen level account balances as of the latest post date. Many partner systems instead roll current-year earnings into the Retained Earnings account itself. Systems differ in how they handle this, so rather than assuming which side carries the current year, use the comparison below, which holds either way.
As a result, comparing the Retained Earnings line on its own will show a difference roughly equal to year-to-date net income, and that difference grows each month until the partner closes its year. Compare it this way instead:
In the GL Balances for Latest Post Date report, Retained Earnings + Sum of P&L (as of the latest post date) should equal the partner’s Retained Earnings balance. For example, if data is loaded through June 2026, Pereview reports the Retained Earnings balance as of the December 2025 close, and the Sum of P&L column carries all Income Statement account balances (the accounts that are mapped to the Net Income metric) through June 2026. Added together, they should agree with the partner’s Retained Earnings figure.
Materiality
As a company, set your own materiality threshold. Pereview’s goal is zero variance, however your team may reasonably choose to investigate only differences above an internally defined amount. For instance, if a source system rounds Trial Balances to the nearest dollar while the underlying data is not truly rounded, variances of about a dollar may not be worth reconciling for your company. Apply the threshold to how you investigate discrepancies, not to what you look at: i.e. two small differences that offset each other signal a reclass regardless of size.
If your organization has not established a materiality threshold, investigate all non-zero differences.
Recommended Best Practices: Tier 2 Validation
☐ The GL Balances for Latest Post Date report has been run for the property.
☐ The Difference column is 0.00 for all accounts, or the ending balances have been manually compared account by account against the partner Trial Balance.
☐ Where the comparison was manual, the PMC Chart of Accounts mapping was used to align accounts.
☐ Retained Earnings has been compared as Retained Earnings plus Sum of P&L against the partner balance.
☐ Every remaining difference has been classified as source data, a reclass or prior period adjustment, an unmapped account, or a grouping issue for Tier 3.
☐ Differences above your materiality threshold have been investigated.
☐ Offsetting pairs of differences have been reviewed regardless of size.
☐ Updated statements have been requested for any period affected by a prior period adjustment.
Tier 3 Validation: Is the Data Mapped Correctly?
Tier 2 confirms that individual account balances are correct. Tier 3 confirms that those accounts are grouped correctly, so that the statements, subtotals, and dashboards your team reports on display correctly. These are different questions: every account can tie out while NOI still differs, because NOI also depends on how accounts are grouped rather than purely on the account balances themselves.
Two configuration layers within Pereview control these account groupings. Account Hierarchies determine where an account appears on financial statements such as the Balance Sheet and Income Statement. Metric Mappings determine how an account rolls into KPIs and dashboard figures such as Net Income, NOI, or debt metrics. An account may be correct in one metric and absent in the other.
Part A: Metric Mapping and Hierarchy Verification
Use these steps to confirm that loaded data is appearing in the right place.
- Cross-check General Ledger Against Statements: Navigate to Formatted Reports and run the GL Transaction Detail report. If the ledger contains accounts with balances that the statements do not reflect, the data is loaded correctly, and the configuration is simply not displaying it.
- Run the Metric Mapping Report: Navigate to Formatted Reports and select Metric Mapping.
- Filter and Export: Select the specific metrics you want to audit, such as Debt Service, Expenses, or Revenue, and export the list to Excel. The second tab of the report also provides a visual of which accounts are mapped to which metrics.
- Verify Account Groupings: Ensure every account from your Chart of Accounts is mapped to the correct metric. For example, check that all appropriate operating revenue and expense accounts are included in the NOI roll-up.
- Confirm Mapping Logic: An account can be mapped and still be mapped incorrectly. Check that each account’s type agrees with where it lands, revenue accounts in revenue groupings, expense accounts in expense groupings, and balance sheet accounts only on the balance sheet.
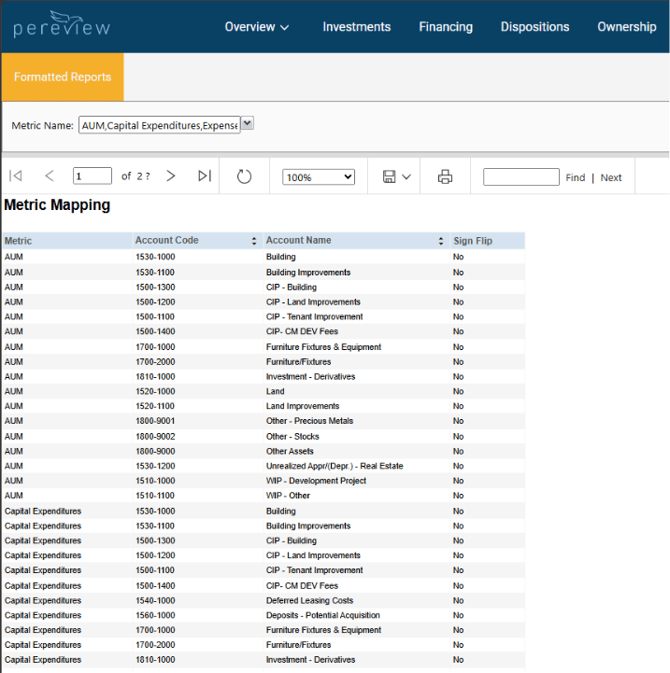
A Metric Mapping report showing the accounts mapped to the AUM and Capital Expenditures metrics. Metrics drive the dashboard widgets and KPI reporting. This report also functions as the upload format, using the “Metric Mapping Upload” template.
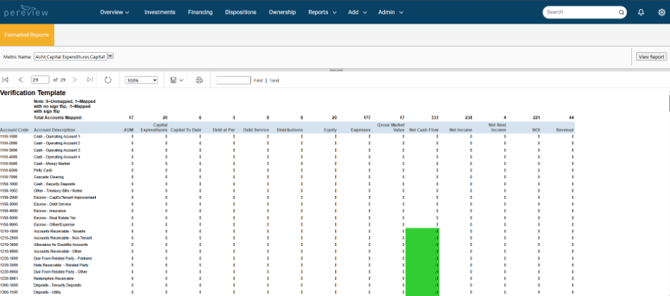
The last page of a Metric Mapping report is the Verification Template. This shows a matrix of which accounts are mapped to each metric and is useful for quickly auditing Metric Mapping.
Important: Adding a new account to the Pereview Chart of Accounts does not automatically add it to hierarchies or metric mappings, so new accounts are often the cause of mapping issues. Whenever a partner begins using a new account, confirm it is mapped to the correct Pereview account, added to the Account Hierarchy, and added to the necessary Metric Mappings before relying on reports or dashboards.
Part B: Reconciling Revenue, Expenses, and NOI
With the mapping confirmed, reconcile the subtotals your team reports on against the partner Income Statement. To compare activity over a period, use the Income Statement Over Period to validate the Account Hierarchy and the GL Metric Over Period report to validate the Metric Mapping.
- Agree on Basis of Comparison: Some partner systems present more than one NOI line, calculated on different bases. Establish which line you are reconciling against before concluding anything differs and use the same basis every period.
- Ensure Partner Provided Statement is Up to Date: Comparing an out-of-date Income Statement to the latest data in Pereview will create the illusion of errors where there may be none, even when the period of comparison appears to be the same. Ensure the partner-provided statement includes any prior period adjustments and the latest data that has been loaded to Pereview.
- Compare Revenue, Expenses, NOI, and Net Income: Run the reports for the same date range as the partner Income Statement and compare each subtotal.
- If Revenue and Expenses Tie but NOI Does Not: Look Above and Below the NOI Line. This is the most common Tier 3 issue. An account is classified as operating in one system and non-operating in the other, so both totals are correct and the split between them is not. Resolve it by agreeing which side the account belongs on or noting an accepted variance. Contact Pereview Support (Support@PereviewSoftware.com) to adjust the Account Hierarchy if needed.
- Compare the Dashboard Figures as Well as the Reports: Dashboard widgets are driven by the Metric Mapping while the statements are driven by the Account Hierarchy. Comparing the Asset or Collateral Overview figures against the partner Income Statement is therefore part of Tier 3, and a disagreement between the dashboard and the statement tells you which of the two layers to look at.
- Check Hierarchy and Metric Mapping Against Each Other: When the Income Statement and the dashboard(s) disagree, an account is usually correct in one layer and missing from the other.
Accepted variances: Some difference between a partner NOI and a Pereview NOI is normal, because the two systems do not always group accounts the same way and Pereview may carry data the partner statement does not. The goal of Tier 3 is not always a zero variance; it is a variance you understand and expect. Document your accepted variances by property, so that in later periods you can tell an expected difference from a new problem at a glance.
Part C: Tracing a Specific Line Item
If a specific line item looks incorrect, for example a Commercial Vacancy account is mapped to a Multifamily section, trace it back to the mapping.
- Run PMC Chart of Accounts Report: It lists every source account and the Pereview account it maps to.
- Audit Descriptions: Review each source account description against the Pereview account code to confirm the conversion logic is sound. Use both the partner and Pereview statements to understand how each account is grouped and confirm the account type agrees with where the account lands.
- Correct the Mapping if Needed: For a small number of accounts, edit the mapping directly in the PMC Chart of Accounts grid. For a larger set of corrections, use the bulk upload template. Map by where the account sits in the partner’s Balance Sheet and Income Statement structure rather than by account name similarity, which is the most common source of mapping errors.
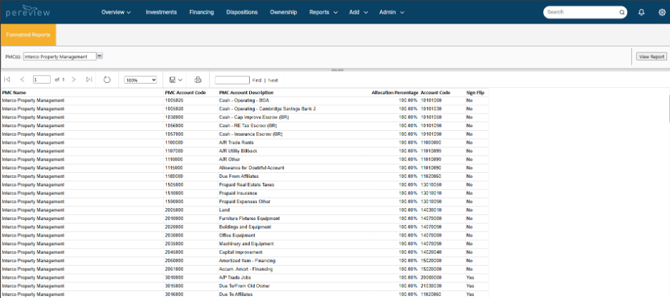
A PMC Chart of Accounts report. Like Metric Mapping, this report also functions as the upload format, using the “PMC to Account Mapping” template. Using this upload will populate both the PMC Chart of Accounts itself and the mapping to the Pereview COA.
Important Note: A mapping correction applies to data loaded from that point forward. It does not re-map data already in the system. If the error affects periods you have already loaded, correct the mapping and then contact Pereview to have the affected history refreshed on the back end.
Recommended Best Practices: Tier 3 Validation
☐ The general ledger has been cross-checked against the Income Statement and Balance Sheet.
☐ The Metric Mapping report has been run for the metrics you rely on.
☐ Every account carrying a balance appears in the correct Account Hierarchy and Metric Mapping.
☐ Account types agree with where each account lands on the statements.
☐ Any newly created source accounts have been mapped, added to the hierarchy, and added to metrics.
☐ The basis of comparison has been agreed where the partner statement shows more than one NOI line.
☐ Revenue, Expenses, and NOI have been compared for the same date range on both sides.
☐ Any NOI difference where Revenue and Expenses tie has been investigated as an above-line versus below-line classification.
☐ Hierarchy total rows and intermediate subtotals have been reviewed where a subtotal does not roll up.
☐ Dashboard figures have been compared against the partner Income Statement.
☐ Accepted variances have been documented by property, with the reason for each.
Operational Data Validation
If you load rent rolls, occupancy, or budgets, validate these alongside the financial data. These checks sit outside the three financial validation tiers but are recommended to be completed in the same monthly validation workflow:
- Rent Roll: Unit or square footage counts and rent amounts should match the most recent rent roll loaded. Run the Rent Roll Details Report for the applicable assets and effective dates. You may also review the Asset or Collateral Tenant Lease page. If rent does not tie as expected, review the charge code mapping in Admin > Site > Configuration > Tenant Lease.
- Occupancy: Occupied and leased percentages should align with the source system. Run the Occupancy History Validation Report, which draws on both historical occupancy and rent roll data. Historical data may appear one-dimensional, with Occupied equal to Leased, because that is the level of detail provided in legacy records. Rent Roll data allows Pereview to track the two figures separately.
- Overview Widgets: Confirm the Revenue, NOI, and Occupancy widget on the Asset or Collateral Overview page reflects the latest month. This widget only displays data based on financials, so if no financial data is loaded for the latest period, any leased or occupied percentages will not display. Note this widget may not be present if your company has made dashboard widget configurations.
- Budget: Run this check after each budget load or revision. Confirm loaded totals by account match the approved operating budget, and that the correct budget year appears in Budget versus Actual reporting.
Recommended Best Practices: Operational Data Validation
☐ Unit or square footage counts match the most recent rent roll loaded.
☐ Rent amounts tie, or the charge code mapping has been reviewed where they do not.
☐ Occupied and leased percentages align with the source system.
☐ The Revenue, NOI, and Occupancy widget reflects the latest month for each asset.
☐ Budget totals by account match the approved operating budget, and the correct budget year appears in Budget versus Actual reporting.